
Alcohol is big business in the United States, and I used to be a part of it to the tune of more than $4,000 per year. Exactly how big an industry is it? According to a new report by Ken Research, the U.S. market for alcohol will grow to $252.5 billion in 2017. If this report is accurate, the alcohol market in the U.S. this year will be $218 billion. This is significantly larger than what was estimated by the U.S. Department of Agriculture for 2012, $170.5 billion.
My apologies to those of you whose eyes are already starting to glaze over. As my husband said when he edited this post: “Statistics. Damn statistics!” I, for one, find this very interesting. One reason is that I’m a closet data geek with a Master’s degree in Applied Economics. Another is that I was curious whether my estimate for the cost of my own annual wine consumption ($4,440) is a reasonable estimate. Hopefully, there are others out there who are also interested to see the numbers.
To evaluate whether I’m in the ballpark, I was going to start by comparing my estimate to the best available figure for the average American’s spending on alcohol. I was thinking something as simple as dividing the total spending in the industry in one year by the number of Americans who drink. For every dozen people that drink PBR or do shots of Jäger, there must be at least a few people who like classier wine than I can afford, or who regularly sip Cosmos in Greenwich Village. I know I’m in between these two types of drinkers, but where, exactly? I’ll start by comparing myself to the average and go from there.
I’ve decided to use the lower U.S.D.A number, because it’s based on the “total value of all food expenditures by final purchasers.” Perhaps the other report includes wholesale purchases, marketing spending, and other stuff. That U.S.D.A. number was $170.5 billion in 2012. The Census data I found is also for 2012, so that works perfectly. The Census says the total U.S. population then was 312 million, with about 242 million of these people being adults. A recent Gallup Survey estimates that two-thirds of American adults drink alcohol. This is consistent with the estimate I found when researching a previous article.
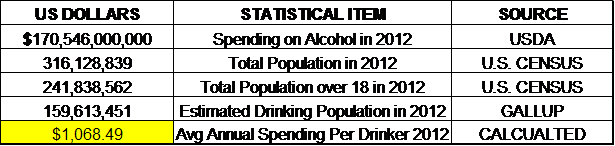
What does all of this mean? It means that the average drinking American spent about $1,068 a year on alcohol in 2012. My estimated spend is four times that figure. Holy crap! Is that possible? An answer to that must be embedded in the Gallup data.
Indeed, the Gallup Survey says that only 44% of Americans “appear to be regular drinkers, consuming at least one alcoholic beverage in a week.” If I divide all spending on alcohol by just those people, the average goes up to $1,602 per person. Further, after playing with the data, I figured out that the average weekly consumption for the folks who drink is 6.4 drinks per person. My weekly consumption used to be at least 14 glasses of wine (2 per day), or 2.2 times more than the average for drinkers in the survey. Since $1,602 multiplied by 2.2 equals $3,504, we’re getting much closer to my estimate.
The survey also reveals that men by far prefer beer to wine and also that men report drinking much more than women did. Since wine is more expensive than beer — this price list shows a 24-pack of PBR is about the cost of a mid-priced bottle of wine, my number is looking pretty darn accurate.
Although it’s nice to know that I still have mad applied economics skills, it’s embarrassing to discover that I was spending this much more than the average American on alcohol. I’m so glad I’m not doing that this year. To those readers who stayed with me to the very end of this piece, I thank you very much!
